
IoT, Industry 4.0 and smart cities all mean the same thing at heart: buildings, vehicles and people connected to the internet. Your smartwatch, fitness band and navigation app already make you part of it. Businesses are joining too, with water and electricity meters, temperature sensors in trucks, and leak, vibration and machine hour sensors on production lines.
Key takeaways
- Sensors are cheap and everywhere; making sense of their data is the hard part.
- HAZER shows every sensor as a coloured widget, on web and mobile.
- Alerts tell you what happened and where; charts and reports keep the history.
Sensors are the easy part
Temperature, humidity, door, fuel level, tyre pressure, light, energy and water sensors are now inexpensive and easy to buy, and new vehicles and buildings often have them built in. The real challenge is software that turns large amounts of sensor data into something anyone can understand. That is what HAZER does.
What HAZER is
HAZER, KLOUDIP's IoT platform, receives data from almost any sensor or counter, analyses it and shows it on your laptop or phone.
Web: a control centre in your browser
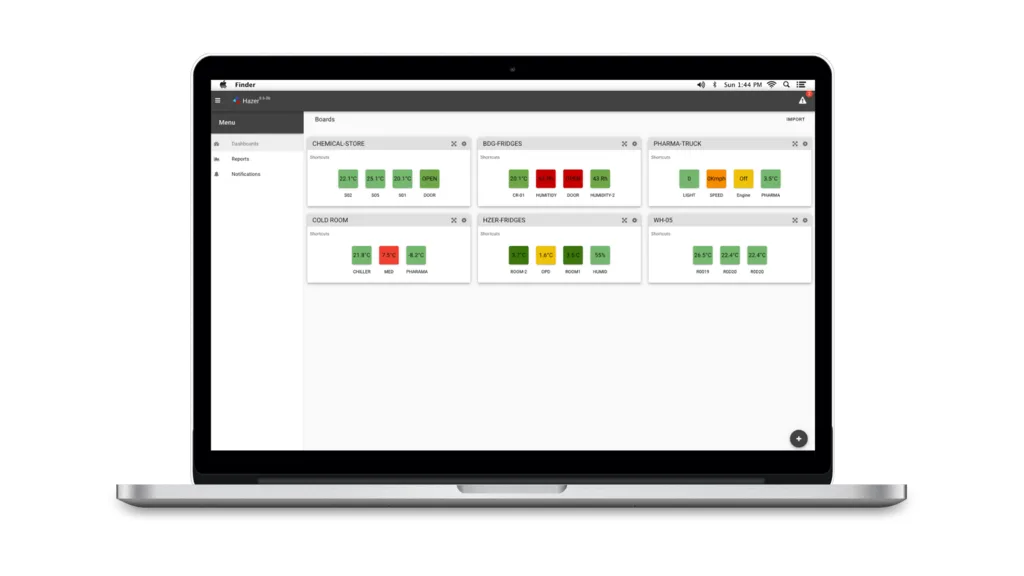
HAZER web dashboard
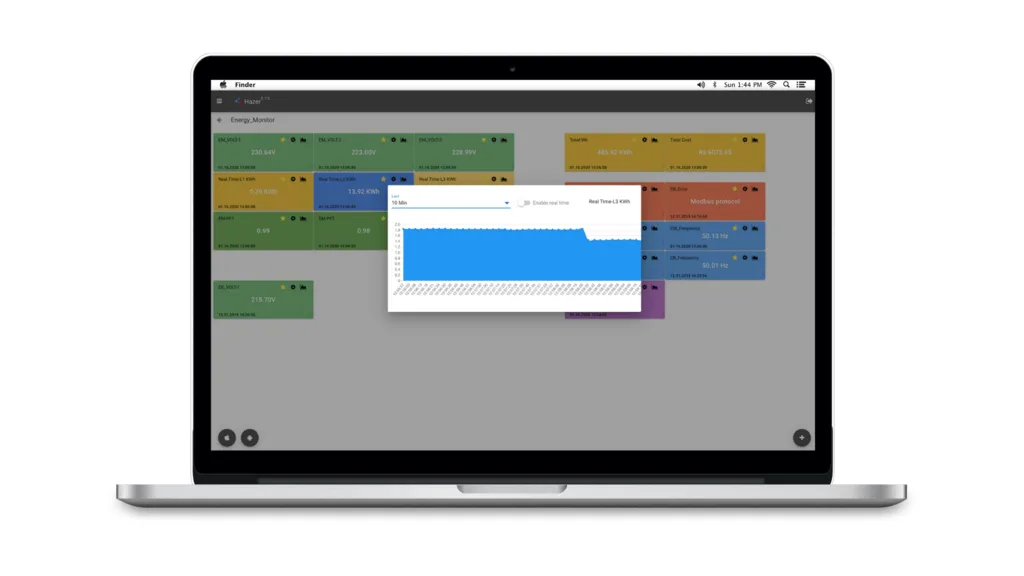
HAZER structures mixed data from hundreds of sensors so that even a first-time user understands it. Each sensor gets its own widget; when the colour or value changes, you notice even a small problem and act fast. GPS adds the location, so you know where as well as what.
Mobile: the same control on a small screen
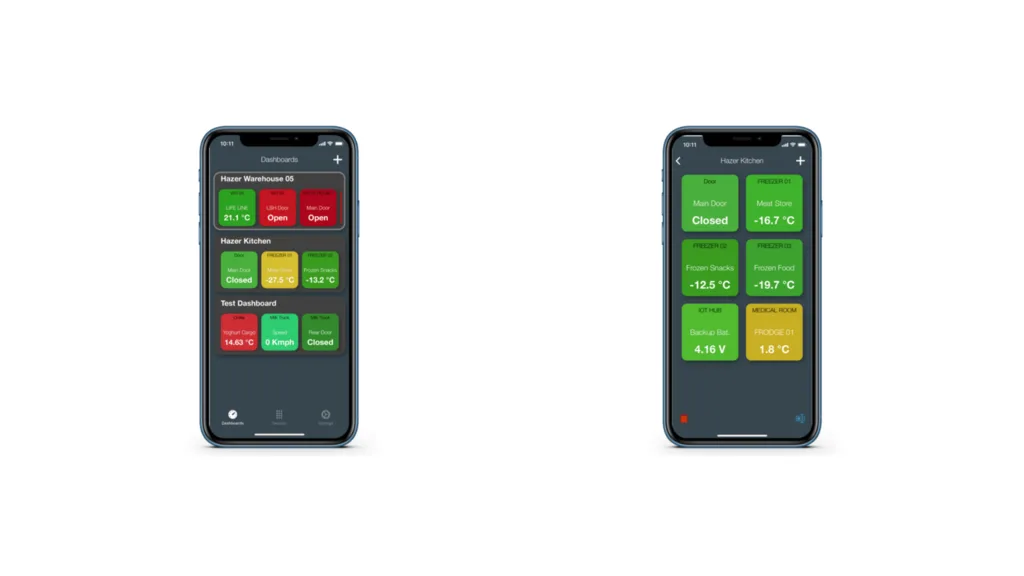
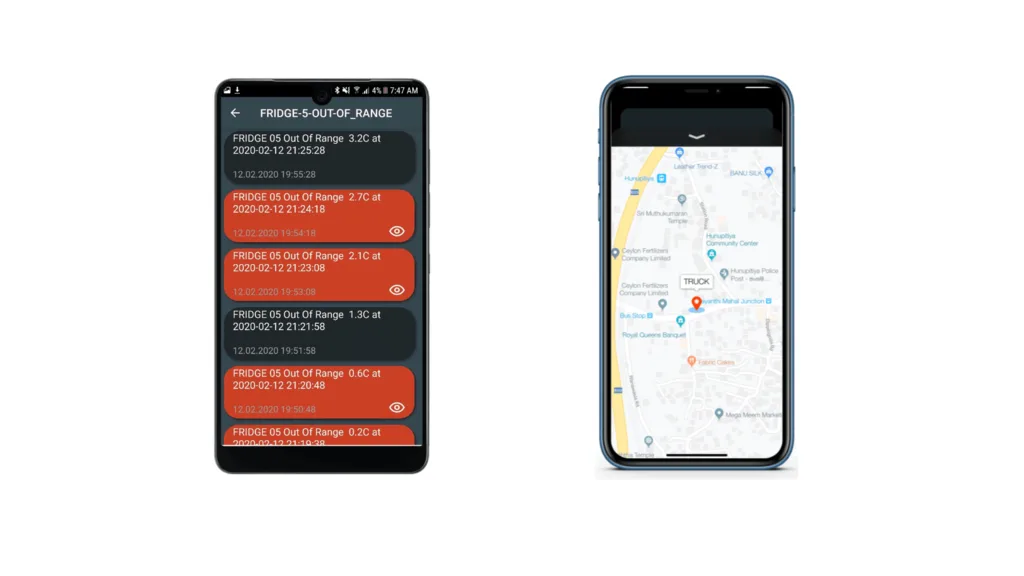
HAZER on iOS and Android
The app has the same functions as the web version and gets the same live data, so managing sensors in the office and in the field is equally simple.
How it works
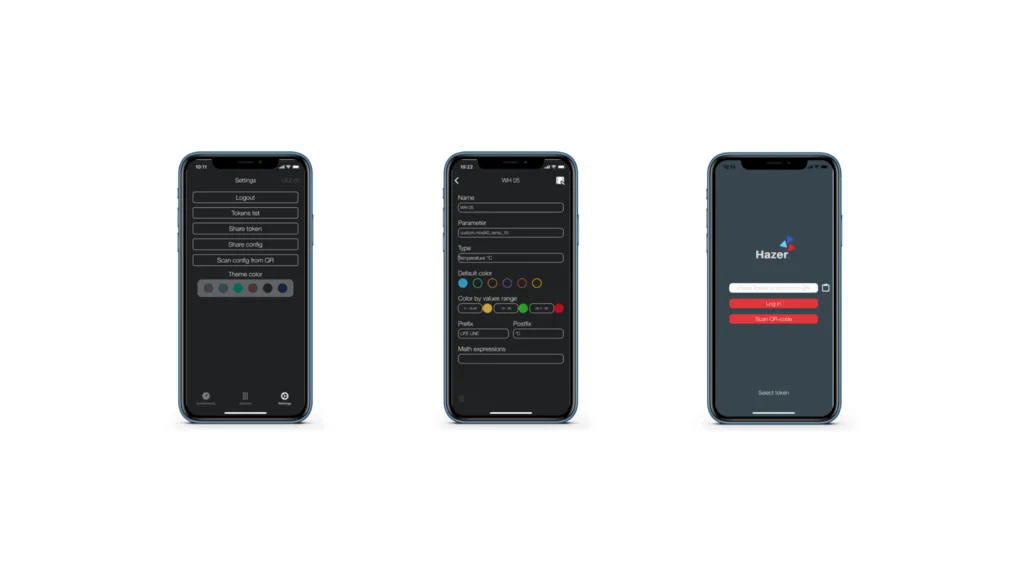
1. Set up sensors
- Give each sensor a clear name, such as "Truck 12 temperature" or "Warehouse humidity".
- Set a type (sensor, counter, tracker, hub) to filter and group.
- Choose colours for normal and abnormal values, so red means trouble at a glance.
- Add units such as °C or litres.
2. Build dashboards
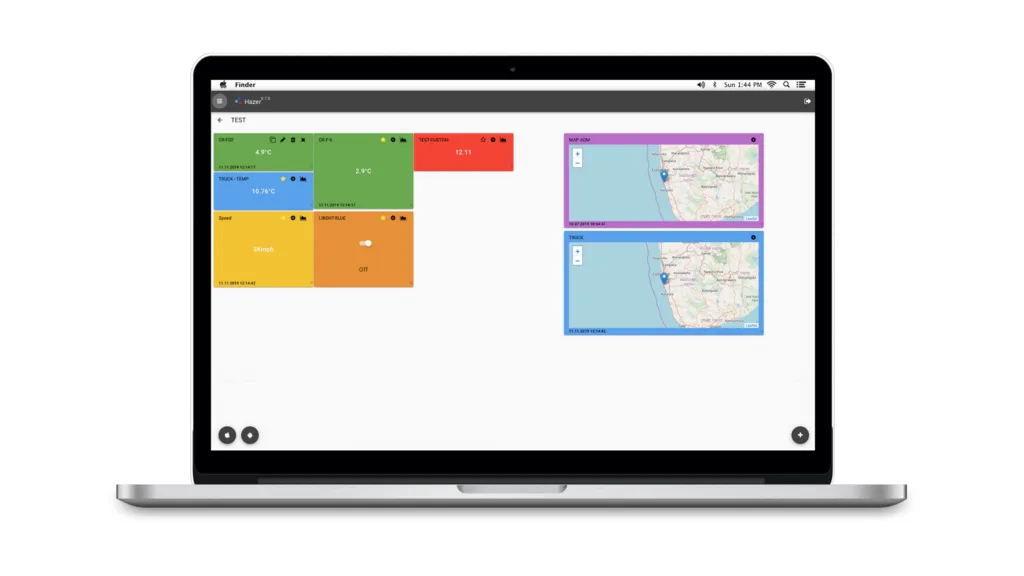
A dashboard is like a desktop with sensor widgets instead of icons. Group them by sensor type (all water meters on one screen) or by place (each vehicle, room or plant on its own screen).
3. Monitor
- By colour: widgets change colour in real time.
- By alert: get notified only when something needs you.
- By location: see on the map where the problem is, and call someone nearby to check.
4. Analyse
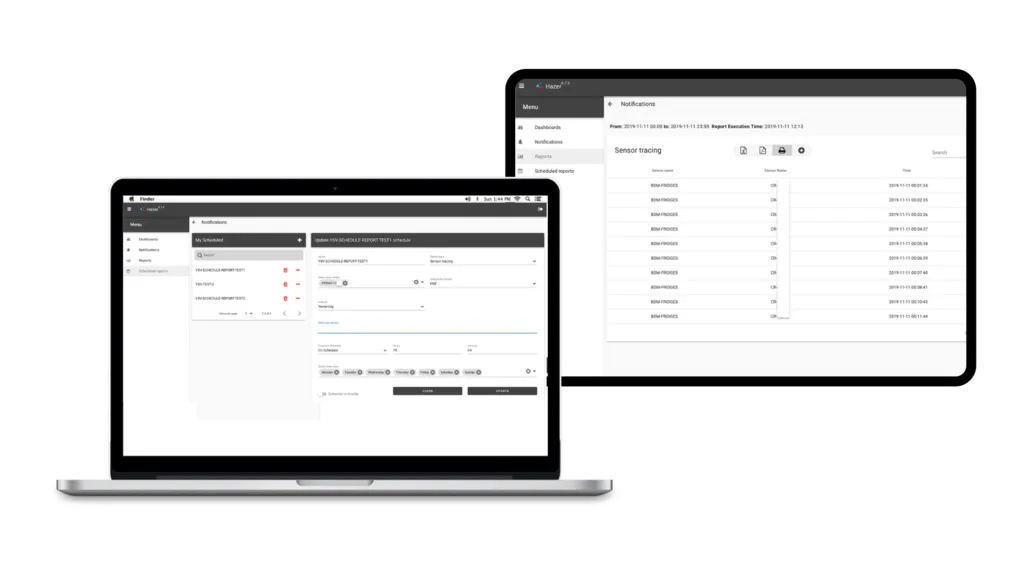
HAZER keeps the full history: charts to follow values over time alongside live readings, and instant or scheduled reports with exact numbers.
Charts
Reports
What companies achieve
- Lower water and electricity bills.
- Temperature-sensitive goods delivered unspoiled.
- Equipment efficiency tracked, and maintenance planned from machine hours.
- Fuel and tyre pressure monitored to cut fuel costs.
- Safe conditions in hospitals for equipment, medicines and blood samples.
HAZER runs in the cloud, stays stable as device numbers grow, and needs no technical background to use.
Looking for ready-made set-ups? See 8 ready-made IoT apps built on HAZER.
Frequently asked questions
Which sensors work with HAZER?
Almost any sensor or counter on the market: temperature, humidity, door, fuel and water level, energy, gas, vibration, machine hours and more.
Do I need technical skills?
No. Widgets, colours, charts and reports are designed to be understood at a glance.
Is there a mobile app?
Yes, on iOS and Android, with the same data as the web version.
Talk to us
Not sure which sensors would pay back fastest? Ask us anything. Contact KLOUDIP
First published on KLOUD LIVE in August 2020. Updated and revised in November 2026.